


Abstract
The balloon-borne hard X-ray polarimetry mission XL-Calibur observed the black hole X-ray binary (BHXRB) Cygnus X-1 (Cyg X-1) during its nearly 6 day long-duration balloon flight from Sweden to Canada in 2024 July. The XL-Calibur observations allowed us to derive the most precise constraints to date of the polarization degree (PD) and polarization angle (PA) of the hard X-ray emission from a BHXRB. XL-Calibur observed Cyg X-1 in the hard state and measured a ∼19–64 keV PD of ( )% (equivalent to an upper limit, at the 99% level, of 11.1%) at a PA of −28° ± 17°, with an 8.7% chance probability of detecting larger PDs than the one observed, given an unpolarized signal. The XL-Calibur results are thus comparable to the 2–8 keV PD and PA found by Imaging X-ray Polarimetry Explorer (IXPE), with a similar agreement between the hard X-ray PA and the radio jet direction. We also discuss the implications of our polarization measurements in the context of models describing the origin of the broadband X-ray and γ-ray emission, to which XL-Calibur provides independent constraints on any proposed emission modeling.

Original content from this work may be used under the terms of the Creative Commons Attribution 4.0 licence. Any further distribution of this work must maintain attribution to the author(s) and the title of the work, journal citation and DOI.
1. Introduction
The polarization of the 2–8 keV X-ray emission from a variety of galactic and extragalactic sources, including BHXRBs, accretion-powered neutron stars, magnetars, pulsar wind nebulae, supernova remnants, and active galactic nuclei (AGNs) (e.g., V. Doroshenko et al. 2022; S. R. Ehlert et al. 2022; H. Krawczynski et al. 2022; I. Liodakis et al. 2022; R. Taverna et al. 2022; J. Vink et al. 2022; F. Xie et al. 2022) has been measured by IXPE (M. C. Weisskopf et al. 2022). Most relevant to our study, IXPE has observed BHXRBs in several states, as covered in the recent review papers of N. R. Cavero & IXPE Collaboration (2024) and M. Dovčiak et al. (2024).
The soft-state emission from BHXRBs is dominated by the diluted multitemperature blackbody emission from a geometrically thin, optically thick accretion disk. Measurements of this emission constrain the inclination of the accretion disk and the black hole spin (that is, the angle between the black hole spin axis and the line of sight to the observer; L.-X. Li et al. 2009; J. D. Schnittman & J. H. Krolik 2009). The hard-state emission includes the Comptonized (upscattered) emission from the coronal plasma, as well as coronal emission reflected by the disk (J. D. Schnittman & J. H. Krolik 2010; W. Zhang et al. 2019; H. Krawczynski & B. Beheshtipour 2022; J. Poutanen et al. 2023). One such BHXRB, Cyg X-1, comprises a (21.2 ) M⊙ black hole, along with a (
 companion, located at a distance of (
 kpc from Earth (J. C. A. Miller-Jones et al. 2021). It is found in the hard state about two-thirds of the time (J. Wilms et al. 2006; V. Grinberg et al. 2013).
The IXPE hard-state observations of Cyg X-1 revealed a 2–8 keV polarization degree (PD) of (4.01 ± 0.20)%, surprisingly high when compared to the predictions of laterally extended corona models (e.g., J. D. Schnittman & J. H. Krolik 2010; H. Krawczynski & B. Beheshtipour 2022), as well as a polarization angle (PA) of −20 7 ± 1
7 ± 1 4 (with positive angles denoting directions east of celestial north), which is aligned with the axis of its radio jet. The measurements indicated an increase in the PD with energy going from (3.6 ± 0.4)% to (5.7 ± 0.9)% between 2 and 8 keV (H. Krawczynski et al. 2022). IXPE revealed a similar alignment of the coronal emission polarization with the radio jets of the BHXRBs Swift J1727.8−1613 (A. Veledina et al. 2023; A. Ingram et al. 2024; C. M. Wood et al. 2024) and GX 339−4 (G. Mastroserio et al. 2025), as well as the AGNs NGC 4151 (K. J. Johnston et al. 1982; J. S. Ulvestad et al. 1998; V. E. Gianolli et al. 2023, 2024) and IC 4329A (S. W. Unger et al. 1987; A. Ingram et al. 2023). This alignment thus seems to be a general feature of the coronal emission from accretion disks across a broad range of black hole masses (M. L. Saade et al. 2024). IXPE soft-state observations of Cyg X-1 showed the PA still being aligned with the radio jet but with a somewhat lower 2–8 keV PD of (1.99 ± 0.13)% (J. F. Steiner et al. 2024; see also A. Jana & H.-K. Chang 2024).
The hard-state polarization results of BHXRBs from IXPE can be interpreted within different theoretical frameworks. In one family of models, the power-law X-rays originate within a horizontally extended corona Comptonizing lower-energy synchrotron emission or standard/truncated accretion disk emission in a hot TC ∼ 100 keV plasma (e.g., R. A. Sunyaev & L. G. Titarchuk 1985; J. Poutanen & O. Vilhu 1993; J. D. Schnittman & J. H. Krolik 2010; H. Krawczynski & B. Beheshtipour 2022, and references therein). The high 2–8 keV PDs measured by IXPE in H. Krawczynski et al. (2022) could be explained by the models analyzed in that study, but only if the inner disk inclination is ≥45°, substantially higher than the  inclination of the overall binary system (J. C. A. Miller-Jones et al. 2021). However, the inclination constraints on those models can be softened by invoking Comptonization in a mildly relativistically outflowing corona (A. M. Beloborodov 1998; J. Poutanen et al. 2023). Moreover, particle-in-cell and resistive general relativistic magnetohydrodynamic simulations, in combination with general considerations, reveal an alternative scenario in which the Comptonization is effected by (likely cold) plasmons, generated by magnetic reconnection, plasma turbulence, or both (A. M. Beloborodov 2017; N. Sridhar et al. 2025). In this context, “cold” refers to the fact that the plasma bulk motion (which is mildly relativistic, at most), rather than the random motion of the plasma particles, dominates the photon energization. Alternative models invoke scattering off cold plasma outflows (M. C. Begelman & M. Sikora 1987; J. Dexter & M. C. Begelman 2024) or synchrotron and inverse Compton emission from the jet or jet walls (M. Moscibrodzka 2024).
With an energy range of ∼19–64 keV, the balloon-borne hard X-ray spectropolarimeter XL-Calibur complements the 2–8 keV range of IXPE. XL-Calibur flew on a long-duration balloon (LDB) flight from Esrange, Kiruna, Sweden to near Kugluktuk, Nunavut, Canada for a roughly weeklong flight, observing Cyg X-1 (in its low/hard state) and the Crab Pulsar/pulsar wind nebula. This paper presents the results from the Cyg X-1 observations. The results from the Crab observations, as well as additional details about the XL-Calibur flight and data analysis, can be found in H. Awaki et al. (2025).
One important advantage of XL-Calibur is that the blackbody emission from the inner accretion disk is not thought to significantly contribute to the detected signal in the hard X-ray energy range, whereas such a component may still be sampled within the lower IXPE bandpass (M. Gierliński & A. A. Zdziarski 1999). Furthermore, depending on the model, direct coronal emission and coronal emission reprocessed and reflected off the accretion disk may contribute differently in the ∼19–64 keV band than in the 2–8 keV band.
Three earlier experiments had reported Cyg X-1 polarization results in the hard X-ray and γ-ray bands. The balloon-borne X-ray polarimetry experiment PoGO+ measured an upper limit of <8.6% (at the 90% level) and a point measurement of ( )% for the 19–181 keV PD (M. Chauvin et al. 2018). At even higher, >100 keV energies, AstroSat, Imager on Board the INTEGRAL Satellite (INTEGRAL/IBIS), and SPectrometer on INTEGRAL (INTEGRAL/SPI) observations revealed evidence for polarized emission, likely resulting from the Cyg X-1 jet—the PD they detected is much higher, and the PA is significantly different from those at soft X-ray energies (P. Laurent et al. 2011; E. Jourdain et al. 2012; J. Rodriguez et al. 2015; T. Chattopadhyay et al. 2024). The data from XL-Calibur thus bridge the gap between the soft X-ray and γ-ray bands with the highest precision polarization measurements of Cyg X-1 in the hard X-rays to date, allowing for an independent constraint on any models invoked to explain the observed emission across the high-energy bandpass.
The rest of the paper is organized in the following manner. We give an overview of the XL-Calibur mission and data analysis methods in Section 2. The observations of Cyg X-1 conducted during the 2024 LDB flight are described in Section 3. We then present our Cyg X-1 polarization results in Section 4, before discussing the implications of these results for the origin of the hard X-ray emission, especially in the context of broadband high-energy polarization results, in Section 5.
2. The XL-Calibur Mission
2.1. Telescope Design
XL-Calibur (Q. Abarr et al. 2021) uses a 12 m optical bench (truss), composed of carbon-fiber tubes and aluminum joints. The truss supports both the X-ray mirror (almost identical to the mirror onboard Hitomi described by H. Awaki et al. 2014) on the front end and the rotating scattering polarimeter (Q. Abarr et al. 2021) enclosed within a ∼3.5 cm thick anticoincidence Bi4Ge3O12 (BGO) shield on the rear end (N. K. Iyer et al. 2023). The Wallops Arc Second Pointer (WASP; D. Stuchlik 2017; P. Galchenko & H. Pernicka 2022), pointing the telescope toward each astrophysical source of interest, is mounted on the gondola connecting the truss to the balloon. During the 2024 flight, it achieved a pointing precision of <10″ for >96% of the observation time.
The X-ray mirror is made of 213 concentric Al shells coated with platinum-carbon multilayers. The mirror achieves a point-spread function (PSF) with a half-power diameter of 2′ and an effective area of ∼300 cm2 at 20 keV and ∼50 cm2 at 60 keV (H. Kuramoto et al. 2023).
The scattering polarimeter is composed of an 80 mm long, 12 mm diameter, low-atomic-number beryllium (Be) rod surrounded by 16 0.8 mm thick, 20 × 20 mm2 footprint, 64 pixel, high-atomic-number (Z ∼ 50) cadmium zinc telluride (CZT) detectors. An identical 17th (imaging) CZT detector is positioned behind the scattering rod to capture unscattered X-rays. The entire shield and polarimeter assembly is rotated at a constant speed of ∼2 revolutions per minute throughout the flight, in order to minimize systematic biases due to azimuthal variations of efficiency, threshold, and angular coverage between different pixels.
Photons preferentially scatter in a direction perpendicular to their electric vector position angle (the EVPA, same as the PA) according to the Klein–Nishina distribution, leading to an azimuthal scattering angle distribution of

where p0 is the true PD of the incident beam, ψ0 is its PA, and μ is the instrument- and observation-specific modulation response (∼0.43 for XL-Calibur observing Cyg X-1 in the hard state) for a 100% linearly polarized beam (M. Aoyagi et al. 2024).16
The atmospheric absorption of lower-energy photons limits the XL-Calibur energy range to photons ≳15 keV as measured in the CZTs. We used pixel-dependent energy thresholds to remove lower-energy noise, with the median pixel threshold being ∼15.4 keV with a standard deviation of ∼4.7 keV. The signal flux drops off rapidly at higher energies and goes below the background ∼60 keV as measured in the CZTs. Taken together, these effects limit the effective signal energy range to 15–60 keV as measured in the CZTs after scattering, which corresponds to the range of ∼19–64 keV for incident photons, as based on simulations (M. Aoyagi et al. 2024) wherein physical effects such as Compton scattering and the energy resolution (3.8 keV at 20 keV and 11.7 keV at 64 keV, as detailed in Q. Abarr et al. 2021) have been accounted for.
2.2. Data Analysis
The data analysis uses events that triggered only one CZT pixel and that passed the cuts suppressing noisy channels. Additionally, only events without a BGO shield veto, and of energies between 15 keV and 60 keV as recorded in the CZT detectors, corresponding to ∼19–64 keV for the incident photons (see H. Awaki et al. 2025 for further discussion), are used.
For each event, an azimuthal scattering angle is calculated by assuming that the photon scattered off an offset-corrected scattering location into the CZT channel where it was detected, where the offset used is given by the background-subtracted mean position of counts in the imaging CZT detector for each day (see M. Aoyagi et al. 2024 for a discussion of the necessity and benefit of such a correction). The azimuthal scattering angle is then converted into the Stokes parameters (F. Kislat et al. 2015) and referenced to celestial north by accounting for the rotation of the polarimeter, the bank of the telescope (as calculated by the WASP star trackers and inertial navigation unit), and the 90° angular difference between the preferred scattering direction from the actual PA. We then performed an exposure-weighted background subtraction to obtain the Stokes parameters of the Cyg X-1 signal.
Following the approach in H. Awaki et al. (2025), initial point-estimates for the PD17 and PA are defined by

In the case of Cyg X-1, the PD magnitude is comparable to the minimum detectable polarization at the 99% confidence level (MDP99, the smallest PD that could be detected at this confidence level), a point at which the bias resulting from the positive-definiteness of the PD will affect the result (H. Awaki et al. 2025). We thus use a Bayesian analysis for determining the probability density distribution of the posterior. A prior of  is used, which presupposes that all PD and PA values are equally likely (J. L. Quinn 2012; M. Chauvin et al. 2017; Q. Abarr et al. 2020; M. Kiss & M. Pearce 2022). Finally, the 1σ error intervals of the PD (positive-definite) and of the PA are found through marginalizing the posterior over the other variable and calculating the values encompassing the densest 68.27% of the total probability. Even in the cases when a measurement is below the MDP99, useful constraints on the PA can still be derived from such Bayesian analyses (H. Li et al. 2025).
3. The Cyg X-1 Observations and Lightcurves
XL-Calibur was launched from the Esrange Space Center in Sweden on 2024 July 9 at 03:04 UTC and landed near Kugluktuk in Canada on 2024 July 14 at 23:19 UTC. About 43 hours were spent observing Cyg X-1 across 4 days, at elevations between ∼25° and ∼55°. During these observations, the telescope performed an ON/OFF cross-like nodding pattern centered on the source, with ON observations of 18 minutes each, interspersed with OFF observations (at an offset of 1° from the source) of 12 minutes each.
The rates obtained in the polarimeter during the ON and OFF observations are shown in the lightcurves of Figure 1, which displays a clear detection of a Cyg X-1 signal rate of up to ∼1.0 Hz above a stable background rate of ∼0.35 Hz. The diurnal variations of the signal rate generally stem from the elevation-dependent atmospheric column density, which results in varying levels of detected flux as the source transits the sky each day.

Figure 1. On-source (red circles) and off-source/background (black squares) events, of energies between ∼19 and 64 keV and arriving in the polarimeter detectors, passing the analysis cuts described in Section 2.2. Time bins of duration no longer than 300 s are used. The daily gaps between Cyg X-1 observations were used for observing the Crab (H. Awaki et al. 2025). Smaller variations within each day (for example, the drop in the third observation) are generally correlated with changes in the elevation of the source.
Download figure:
Standard image High-resolution imageAcross the 4 days of Cyg X-1 observations, a total number of ∼78,500 events were detected in the 16 circumjacent (polarimeter) CZT detectors. Out of these 78,500 events, approximately 62,400 arrive during on-source observations of Cyg X-1, and approximately 16,100 occur during off-source observations (purely background events).
Figure 2 presents the ratio of the Cyg X-1 count-rate spectrum divided by the corresponding Crab spectrum, with both measured by XL-Calibur during the same balloon flight with a similar column density distribution (an average line-of-sight column density of 5.5 g cm−2 for the Crab and 6.0 g cm−2 for Cyg X-1). This ratio of energy spectra follows a EΔΓ power law, with ΔΓ ≈ 0.60 ± 0.03. The time-averaged energy spectrum of the Crab has a photon index of ΓCrab = 2.10 ± 0.02, as described by K. K. Madsen et al. (2015) for the 1–100 keV bandpass (cospectral with XL-Calibur), with  .18
Thus, we estimate a Cyg X-1 photon index of ΓCyg X − 1 ≈ ΓCrab − ΔΓ ≈ 1.50 ± 0.04 during our observations, consistent with Cyg X-1 being in the hard state (J. Wilms et al. 2006). A detailed spectral and spectropolarimetric analysis using complete instrument response matrices for XL-Calibur, in combination with contemporaneous NICER and NuSTAR observations, will be published in a forthcoming paper, which will permit a precise determination of the Cyg X-1 spectral index.
.18
Thus, we estimate a Cyg X-1 photon index of ΓCyg X − 1 ≈ ΓCrab − ΔΓ ≈ 1.50 ± 0.04 during our observations, consistent with Cyg X-1 being in the hard state (J. Wilms et al. 2006). A detailed spectral and spectropolarimetric analysis using complete instrument response matrices for XL-Calibur, in combination with contemporaneous NICER and NuSTAR observations, will be published in a forthcoming paper, which will permit a precise determination of the Cyg X-1 spectral index.

Figure 2. Ratio (blue data points) of the Cyg X-1 to the Crab background-subtracted signal count detection rates as a function of energy, with both axes in logarithmic scale. The counts are between 20 and 50 keV, as measured in only the polarimeter CZT detectors, and are binned in intervals of 5 keV. The Cyg X-1 energy spectrum is harder than the Crab spectrum by ΔΓ ≈ 0.60 ± 0.03. The red line gives the best linear fit to this ratio spectrum. The uncertainty on the ΔΓ is given by standard error propagation, taking into account the uncertainty arising both from the division of the two spectra as well as from the determination of the linear fit slope.
Download figure:
Standard image High-resolution image4. Cyg X-1 Hard X-Ray Polarimetric Results
Figure 3 displays the background-subtracted azimuthal count distribution, fitted with a component of periodicity 180° as well as a component of periodicity 360°. The former reflects the polarization of the signal; the latter mainly arises from an offset of the telescope’s observing axis from the nominal scattering location at the center of the beryllium rod (H. Awaki et al. 2025).19

Figure 3. Azimuthal scattering angle distribution (black data points) of the ∼19–64 keV background-subtracted Cyg X-1 signal arriving in the polarimeter detectors. The overall best-fit (purple solid line) is shown, as well as the 180° component (red dotted line) and 360° component (blue dashed line) contributions to the overall signal.
Download figure:
Standard image High-resolution imageThe normalized Stokes parameters of the signal are calculated to be Q/I = 0.033 ± 0.026 and U/I = −0.046 ± 0.026. These results for the entire ∼19–64 keV energy range, as well as results for the ∼19–35 keV and ∼35–64 keV energy ranges, are shown in Figure 4 and listed in Table 1.

Figure 4. The ∼19–64 keV (red dot), ∼19–35 keV (green square), and ∼35–64 keV (blue triangle) background-subtracted, normalized Stokes results, with error bars giving the 1σ confidence level. The circles delineate the MDP99 values (also given in Table 1) of each of these energy ranges (inner circle ∼19–64 keV, middle circle ∼19–35 keV, and outer circle ∼35–64 keV; all energy ranges as recorded in the CZT detectors).
Download figure:
Standard image High-resolution imageTable 1. The Background-subtracted, Normalized Stokes Q and Stokes U Results, the Marginalized PD and PA Values from the Bayesian Analysis, and the MDP99 Values for the XL-Calibur Observation
| Energy | Q / I | U / I | PD | PA | MDP99 |
|---|---|---|---|---|---|
| (keV) | (%) | (°) | (%) | ||
| ∼19–64 | 0.033 ± 0.026 | −0.046 ± 0.026 |

| −28 ± 17 | 7.8 |
| ∼19–35 | 0.016 ± 0.035 | −0.028 ± 0.035 |

| −31 ± 40 | 10 |
| ∼35–64 | 0.051 ± 0.038 | −0.066 ± 0.038 |

| −26 ± 17 | 12 |
Note. The two energy subdivisions are chosen so as to have approximately equal background-subtracted counts. All uncertainties are given at the 1σ level (∼68% Gaussian probability content). The same modulation factor μ is used for all calculations.
Download table as: ASCIITypeset image
Figure 5 displays the results from the Bayesian analysis, showing the posterior distributions of the PDs and PAs. We infer a marginalized ∼19–64 keV PD of ( )% and PA of −28° ± 17° (Table 1), with uncertainties determined by the 1σ intervals of the marginalized distributions. Given that the PD is below the MDP99 value, we also give its equivalent upper limit, at the 99% level, of 11.1%.

Figure 5. Results from the Bayesian analysis of the XL-Calibur data. Contour lines denote the 1σ, 2σ, and 3σ credibility regions. The color/darkness scale denotes the lowest-percentile credibility level into which each region could fall.
Download figure:
Standard image High-resolution imageWe derive a concrete measure of statistical significance for the signal by making use of the normalized Stokes parameters, q = Q/I and u = U/I, and their 1σ errors, σq and σu. Using the statistical distance,  , between a polarization measurement and an unpolarized beam, the probability pc(d) for obtaining a larger PD by chance is given by

For the overall Cyg X-1 result, we thus infer a chance probability of pc = 0.087 for detecting larger PDs than the one we observed, given an unpolarized signal. This measure of significance confirms, more rigorously, the approximate significance that one would nominally obtain through dividing the measured PD value in Table 1 by its corresponding error.
However, considering an alternative method of analysis that may improve the significance of the measurement, one may rotate the coordinate frame for calculating the Stokes parameters such that the +q axis is aligned with the PA found by IXPE (H. Krawczynski et al. 2022). This analysis thus takes, as its assumption, that the PAs are the same between the soft and hard X-ray regimes. Doing so yields q = 0.055 ± 0.026 and u = −0.012 ± 0.026. Given the reduction to a one-dimensional problem through the aforementioned assumption (and thus discarding the u), performing the same analysis as the previous paragraph, but using instead d = (q/σq) and

leads to a probability pc = 0.031 for obtaining, by chance, larger PDs than the PD observed, given an unpolarized signal.
5. Discussion and Summary
XL-Calibur observed Cyg X-1 in the low/hard state in 2024 July. The observations revealed a ∼19–64 keV PD of ( )% (equivalent to an upper limit, at the 99% level, of 11.1%) at a PA of −28° ± 17°, similar to the 2–8 keV PD of (4.01 ± 0.20)% and PA of −20
 7 ± 1
7 ± 1 4 measured by IXPE. The results are also consistent with the previous best measurement, from PoGO+ (M. Chauvin et al. 2018), compared to which XL-Calibur offers around a factor of 2 reduction in the PD error. The measured PA of the hard X-ray emission, just as for the soft X-ray results from IXPE, aligns with the radio jet as determined from Very Long Baseline Array (VLBA) observations at 8.4 GHz (J. C. A. Miller-Jones et al. 2021). The overlay of the projection of the polarization results from both bandpasses atop the radio jet image is shown in Figure 6.

Figure 6. The polar diagram of measured PD and PA values in the X-ray band overlaid atop the radio jet image from VLBA astrometry data (J. C. A. Miller-Jones et al. 2021); PD values are in percent in the radial direction. Results are given for the XL-Calibur (green) observation across the entire ∼19–64 keV energy range, as well as for the IXPE (magenta) results across its 2–8 keV band. The error bars of the polarization results are given at the 1σ level, as derived from the marginalized Bayesian analysis (for XL-Calibur) and as listed in Table S2 of H. Krawczynski et al. (2022) (for IXPE). The larger error bars of the XL-Calibur result indicate, as mentioned before, a measurement below the MDP99.
Download figure:
Standard image High-resolution imageFigure 7 shows the XL-Calibur data in the context of polarization results obtained across the X-ray and γ-ray bands (the interested reader may see M. L. McConnell 2017 for a review of X-ray and γ-ray polarization techniques and associated difficulties). The low levels of polarization and comparability of the measured PDs and PAs from 2 to ∼64 keV suggest that similar physical mechanisms are responsible for the polarization properties observed in both bands. The ∼19–64 keV X-ray emission from BHXRBs is thought to be dominated by Comptonized emission from the hot coronal plasma, some of which reaches the observer after reflecting at least once off the accretion disk. However, above 100 keV, AstroSat and INTEGRAL measurements indicate a drastic rise of the PD with respect to energy. Indeed, spectral analyses show that the high-energy emission transitions from being corona-dominated (irrespective of the specific coronal emission model being used to explain the hard X-rays) to being jet-dominated between 100 keV and 1 MeV (see D. Kantzas et al. 2021, and references therein). Moreover, the PA seems to swing by ∼90° between the XL-Calibur and AstroSat energy ranges, as would be expected for a transition from emission Comptonized in a horizontally extended corona to synchrotron and/or inverse Compton emission from a jet with an axial magnetic field. However, the AstroSat and INTEGRAL results were obtained from instruments not specifically built for polarimetry, leading to larger systematic errors on the results. The COSI mission, a large and uniform Compton telescope for polarimetry to be launched in 2027, should help resolve this question with precise polarization measurements in its energy range of 200 keV–5 MeV (J. A. Tomsick et al. 2022).

Figure 7. Compilation of Cyg X-1 polarization results from the X-ray band to the γ-ray band. The shaded regions show the 2–8 keV energy range of IXPE (left), the ∼19–64 keV energy range of XL-Calibur (middle), and the 200 keV–5 MeV energy range of the upcoming Compton Spectrometer and Imager (COSI; right; J. Tomsick et al. 2024). The multiwavelength data are taken from K. S. Long et al. (1980), H. Krawczynski et al. (2022), M. Chauvin et al. (2018), T. Chattopadhyay et al. (2024), P. Laurent et al. (2011), E. Jourdain et al. (2012), and J. Rodriguez et al. (2015). The upper limits for XL-Calibur (at the 99% level) and PoGO+ (at the 90% level) are also given. All of these measurements observe Cyg X-1 in some hard (or intermediate-hard) state (T. Chattopadhyay et al. 2024), except for OSO-8. The solid blue line delineates the PD prediction of the 55° inclination kerrC-light model (see the main text; see also H. Krawczynski & B. Beheshtipour 2022). The dotted orange line delineates the PD prediction of the 90° model from M. Moscibrodzka (2024). Both of these models predict a slight increase of the PD and a roughly constant PA, parallel to the jet, across the IXPE and XL-Calibur energy ranges.
Download figure:
Standard image High-resolution imageFocusing on the X-ray band, Figures 7 and 8 compare the IXPE, PoGO+, and XL-Calibur results with various published theoretical estimates. The prediction of the kerrC-light model (H. Krawczynski & B. Beheshtipour 2022), given by the solid line in Figure 7, assumes a wedge-shaped corona sandwiching a thin, 100%-reflecting accretion disk. The reflection is modeled using Chandrasekhar’s classical results for an infinitely deep electron scattering atmosphere (S. Chandrasekhar 1960). This model has the same parameter values as shown in Table S3 of H. Krawczynski et al. (2022), save for a dimensionless spin parameter a (−1 ≤ a ≤ 1) of 0.94 (as measured by D. J. Walton et al. 2016), an increased accretion rate (for flux normalization purposes), and an inclination angle of 55° (the angle that best fits both soft and hard X-ray data, as shown in Figure 9, given these parameters). Such a model predicts a slight increase of PD (from ∼2% to ∼6%) when going from soft to hard X-rays, as well as a stable PA, parallel to the black hole spin axis. This model is thus one model that is consistent with both the IXPE and XL-Calibur results.

Figure 8. A zoom-in on the models and data in the X-ray band. The kerrC model is a Monte Carlo-based model: 68,040 combinations of system parameters were simulated, with 20,000,000 photons used for each configuration. The IXPE 2024 data come from IXPE observations 03010001, 03010101, and 03003101 of Cyg X-1, which were taken within a couple of months before the XL-Calibur observation, and are analyzed jointly with ixpeobssim (L. Baldini et al. 2022).
Download figure:
Standard image High-resolution image


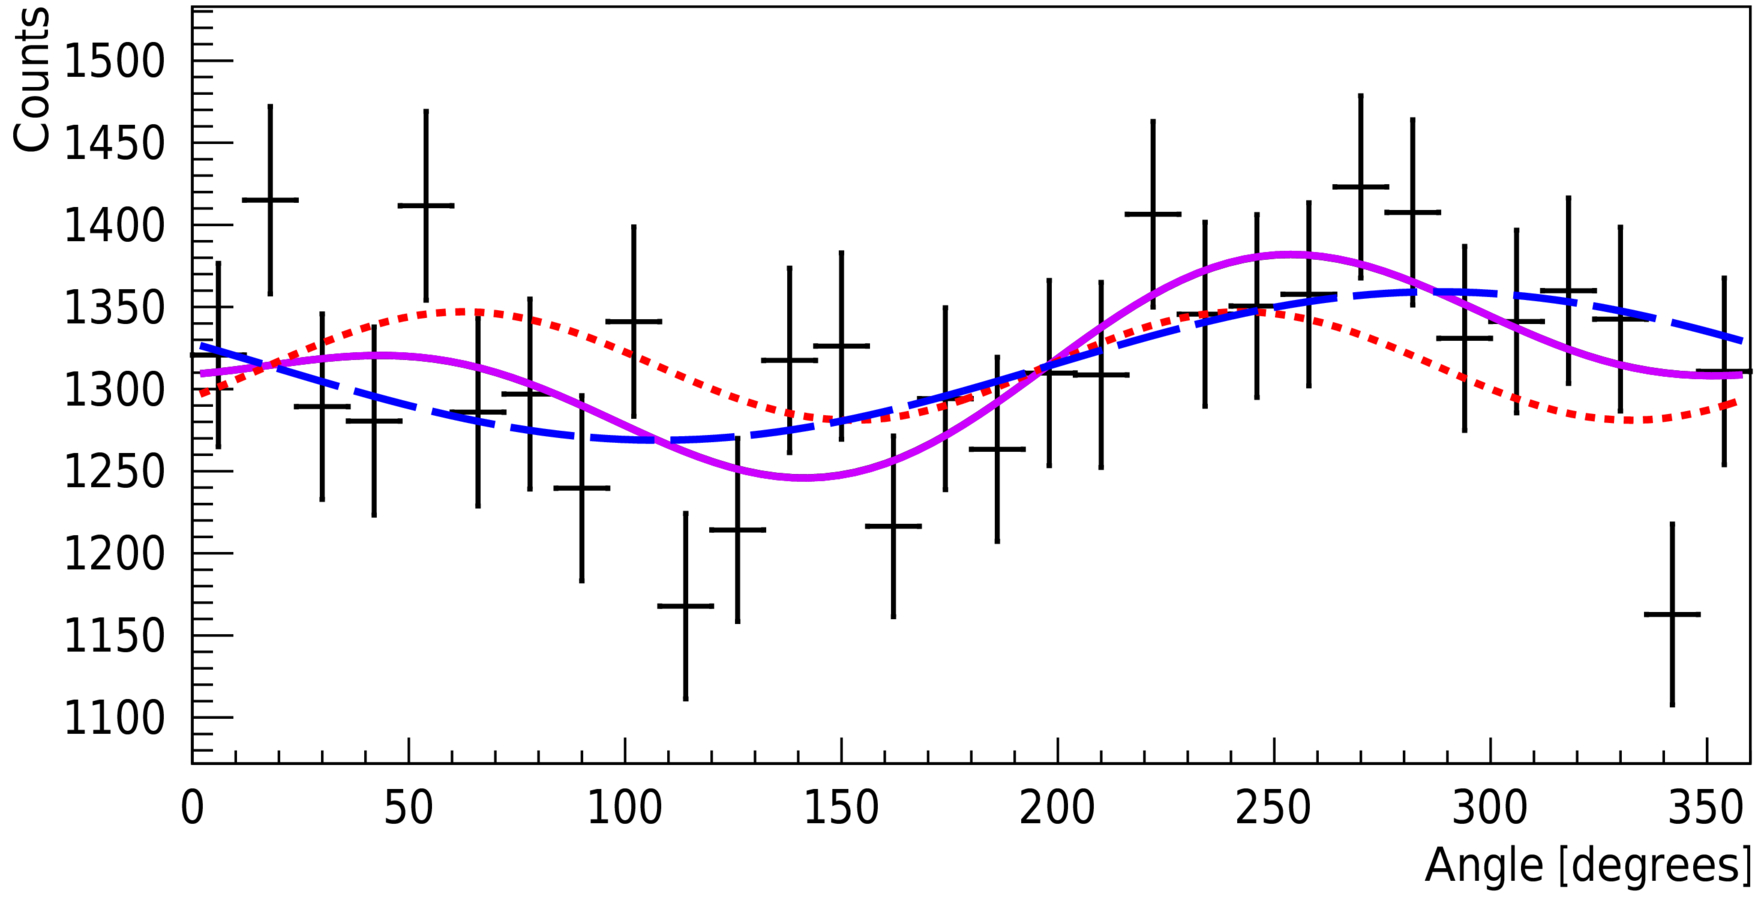


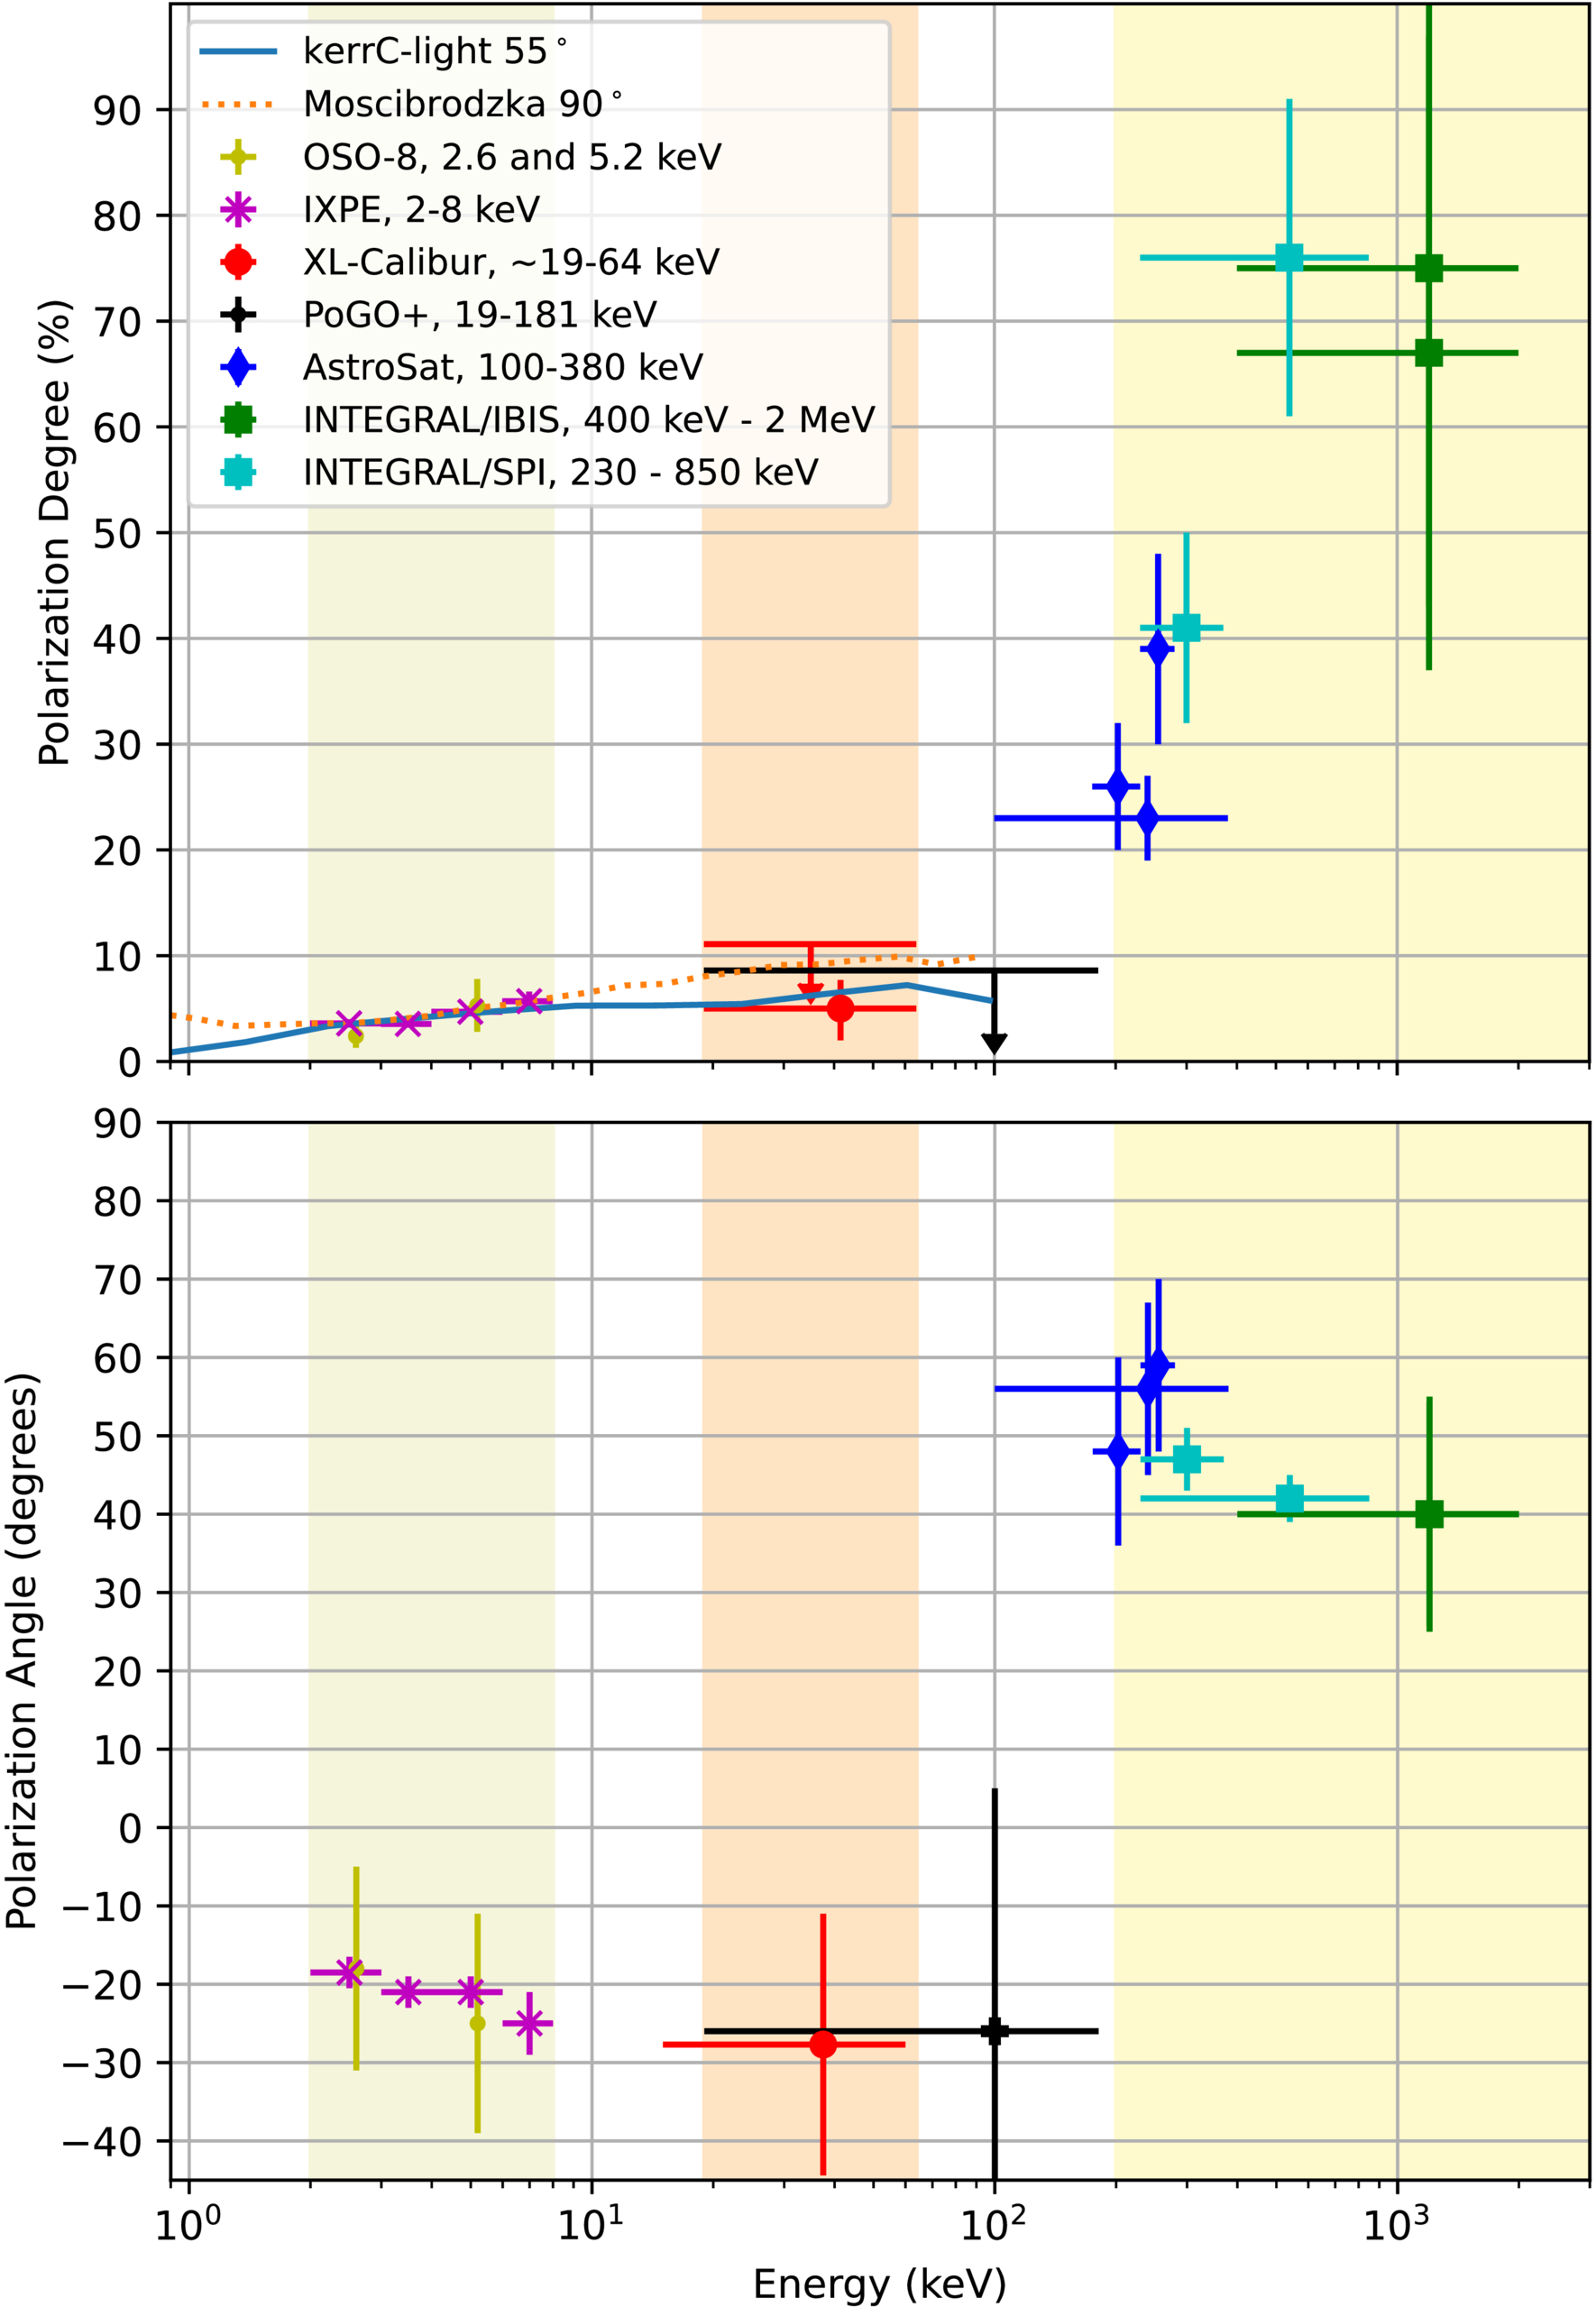

Figure 9. Top: simulated Cyg X-1 energy spectrum from the kerrC-light code, assuming a geometrically thin, optically thick accretion disk with a sandwich corona of opening angle 10°, of optical depth τ = 0.41, and of inclination angle 55°. While the dashed orange line shows the flux of the photons that reach the observer without any scattering off the disk, the dotted green line shows the flux of the photons scattering off the disk one or several times. A dotted–dashed red line is also presented to indicate the power-law index calculated in Figure 2. Bottom: polarization degree spectra of the kerrC-light model from the above panel, varying only the inclination in each instance (with the model from the highest inclination having the highest PDs). The IXPE (from 2022) and XL-Calibur data are overlaid, as in Figures 7 and 8. PD as a function of energy, for the direct and reflected components, is also plotted for the 55° case as dashed and dotted gray lines. The abrupt changes in the flux of the direct component at higher energies reflect the low statistics due to the low proportion of flux it comprises at those energies.
Download figure:
Standard image High-resolution image
The top panel of Figure 9 offers a closer look at this model of inclination 55°, showing the total predicted energy spectrum, as well as the spectrum subdivided into “direct” and “reflected” contributions. The accretion disk emits photons of about a few keV in energy, and these photons gain more energy the more often they scatter in the corona. For a sandwich corona, a larger number of scatterings for a photon (that is, a photon more likely to be at a higher energy) is accompanied by a higher likelihood of one or more encounters and reflections off the disk, given the geometry. In the sandwich model, reflection off the disk thus becomes an integral part of the Comptonization process, and the fraction of reflected photons increases with increasing photon energy. The distinction between direct coronal emission and reflected coronal emission is thus not as meaningful as it would be for models using a more localized corona situated further away from the disk. The power-law index of 1.55 calculated in Figure 2 is overplotted in Figure 7, displaying a reasonable agreement with the spectral flux predicted by kerrC-light in the X-ray regime.
As a further examination of the inclination angles, the bottom panel of Figure 9 shows the PDs predicted by kerrC-light models at several possible inclinations of the black hole. The PDs of the direct and reflected components of the i = 55° model are plotted, as mentioned above, as well. As expected, the PD of the overall model starts very closely following the PD of the reflected component at about the same energy where the reflected flux becomes dominant in the top panel. Models with inclinations <40° have difficulty explaining both the observed IXPE and XL-Calibur PDs. For example, for an inclination of i = 27°, which is close to the inferred inclination angle of the binary (J. C. A. Miller-Jones et al. 2021), the sandwich model of kerrC-light maintains a PD below 3% through the end of the XL-Calibur range. However, A. M. Beloborodov (1998) and J. Poutanen et al. (2023) emphasize that higher PDs can result from coronal plasma outflowing at ∼40% the speed of light or faster, thus allowing for lower inclination angles.
As mentioned in Section 1, several alternative, but related, models have also been proposed in the literature. In the model of M. Moscibrodzka (2024), the X-rays come from the inverse Compton scattering of Bremsstrahlung and synchrotron emission produced in the outflowing jet wall. The high-inclination (90°) result from their general relativistic radiative magnetohydrodynamic simulations reproduces the observed alignment of the soft and hard X-ray PAs with the radio jet, as well as generally tracking the change in PD between the lower and higher energy bands (as displayed in Figures 7 and 8). Similarly, J. Dexter & M. C. Begelman (2024) argue that the Cyg X-1 PDs and PAs can be explained by the inverse Compton scattering of disk emission by a mildly relativistic (∼75% of the speed of light) cold outflow in the shape of a hollow cone, centered on the black hole spin axis, into which the observer looks. N. Sridhar et al. (2025), using general relativistic resistive magnetohydrodynamic simulations, give a physical scenario that could lead to such a configuration: magnetic reconnection producing cold plasmoids, with bulk motion, that inverse Compton scatter longer-wavelength photons into the IXPE and XL-Calibur energy bands. All of these models predict little variation of the PD and PA, provided that the IXPE signal is not heavily contaminated by disk emission.
Although the present data start to provide some indication, a final decision between models of hard X-ray emission from BHXRBs will require both (i) additional observations of BHXRBs in the hard and soft states with the best possible broadband (measuring both soft and hard X-rays) spectropolarimetric coverage, as well as (ii) continued refinement of the various theoretical models. Future flights of XL-Calibur will contribute to this goal through constraining the polarization from more BHXRBs in the hard X-rays. A longer flight from McMurdo in Antarctica, observing southern-hemisphere sources, such as GX 339-4, 4U 1630-47, Swift J1727.8-1613, LMC X-1, and LMC X-3, will significantly increase the number of BHXRBs studied in this energy range, as well as the precision of their polarization measurements.
Acknowledgments
XL-Calibur is a joint mission supported by NASA, JAXA, and the Swedish National Space Agency Rymdstyrelsen. We sincerely thank James Miller-Jones for the data used to produce the VLBA radio jet image. We acknowledge NASA support under grant 80NSSC24K0205. KTH authors are supported by the Swedish National Space Agency (2022-00178 and 2024-00248). M.P. also acknowledges funding from the Swedish Research Council Vetenskapsrådet (2021-05128). The Washington University in St. Louis group acknowledges additional NASA support through the grants 80NSSC20K0329, 80NSSC21K1817, 80NSSC22K1291, 80NSSC22K1883, 80NSSC23K1041, and 80NSSC24K1178, as well as funding from the McDonnell Center for the Space Sciences at Washington University in St. Louis. The University of New Hampshire group acknowledges additional NASA support through the grants 80NSSC24K0636 and 80NSSC24K1762. The Japanese Society for the Promotion of Science (JSPS) has supported this work through KAKENHI grant Nos. 19H01908, 19H05609, 20H00175 (H.M.), 20H00178 (H.M.), 21K13946 (Y.U.), 22H01277 (Y.M.), 23H00117, and 23H00128 (H.M.).
Data Availability
The XL-Calibur data underlying this article are available via the NASA HEASARC data archive, at https://heasarc.gsfc.nasa.gov/docs/xlcalibur/.
Footnotes
- 16
As H. Awaki et al. (2025) describe, the overall modulation factor is likely only known to a (systematic) precision of 0.002. However, this is negligible in comparison with the statistical error/precision that will be stated for the main results of this paper.
- 17
- 18
We have examined the flux data provided by Swift/Burst Alert Telescope (BAT; H. A. Krimm et al. 2013), and compared the flux recorded by that instrument (operating in the 15–150 keV range) during the days that XL-Calibur observed the Crab, to the flux that it recorded during the time frames coincident with the ones used for the measurements of K. K. Madsen et al. (2015). In both cases, the flux is between 0.20 and 0.26 counts cm−2 s−1.
- 19
An expected azimuthal variation due to known asymmetries in the mirror PSF will also contribute.